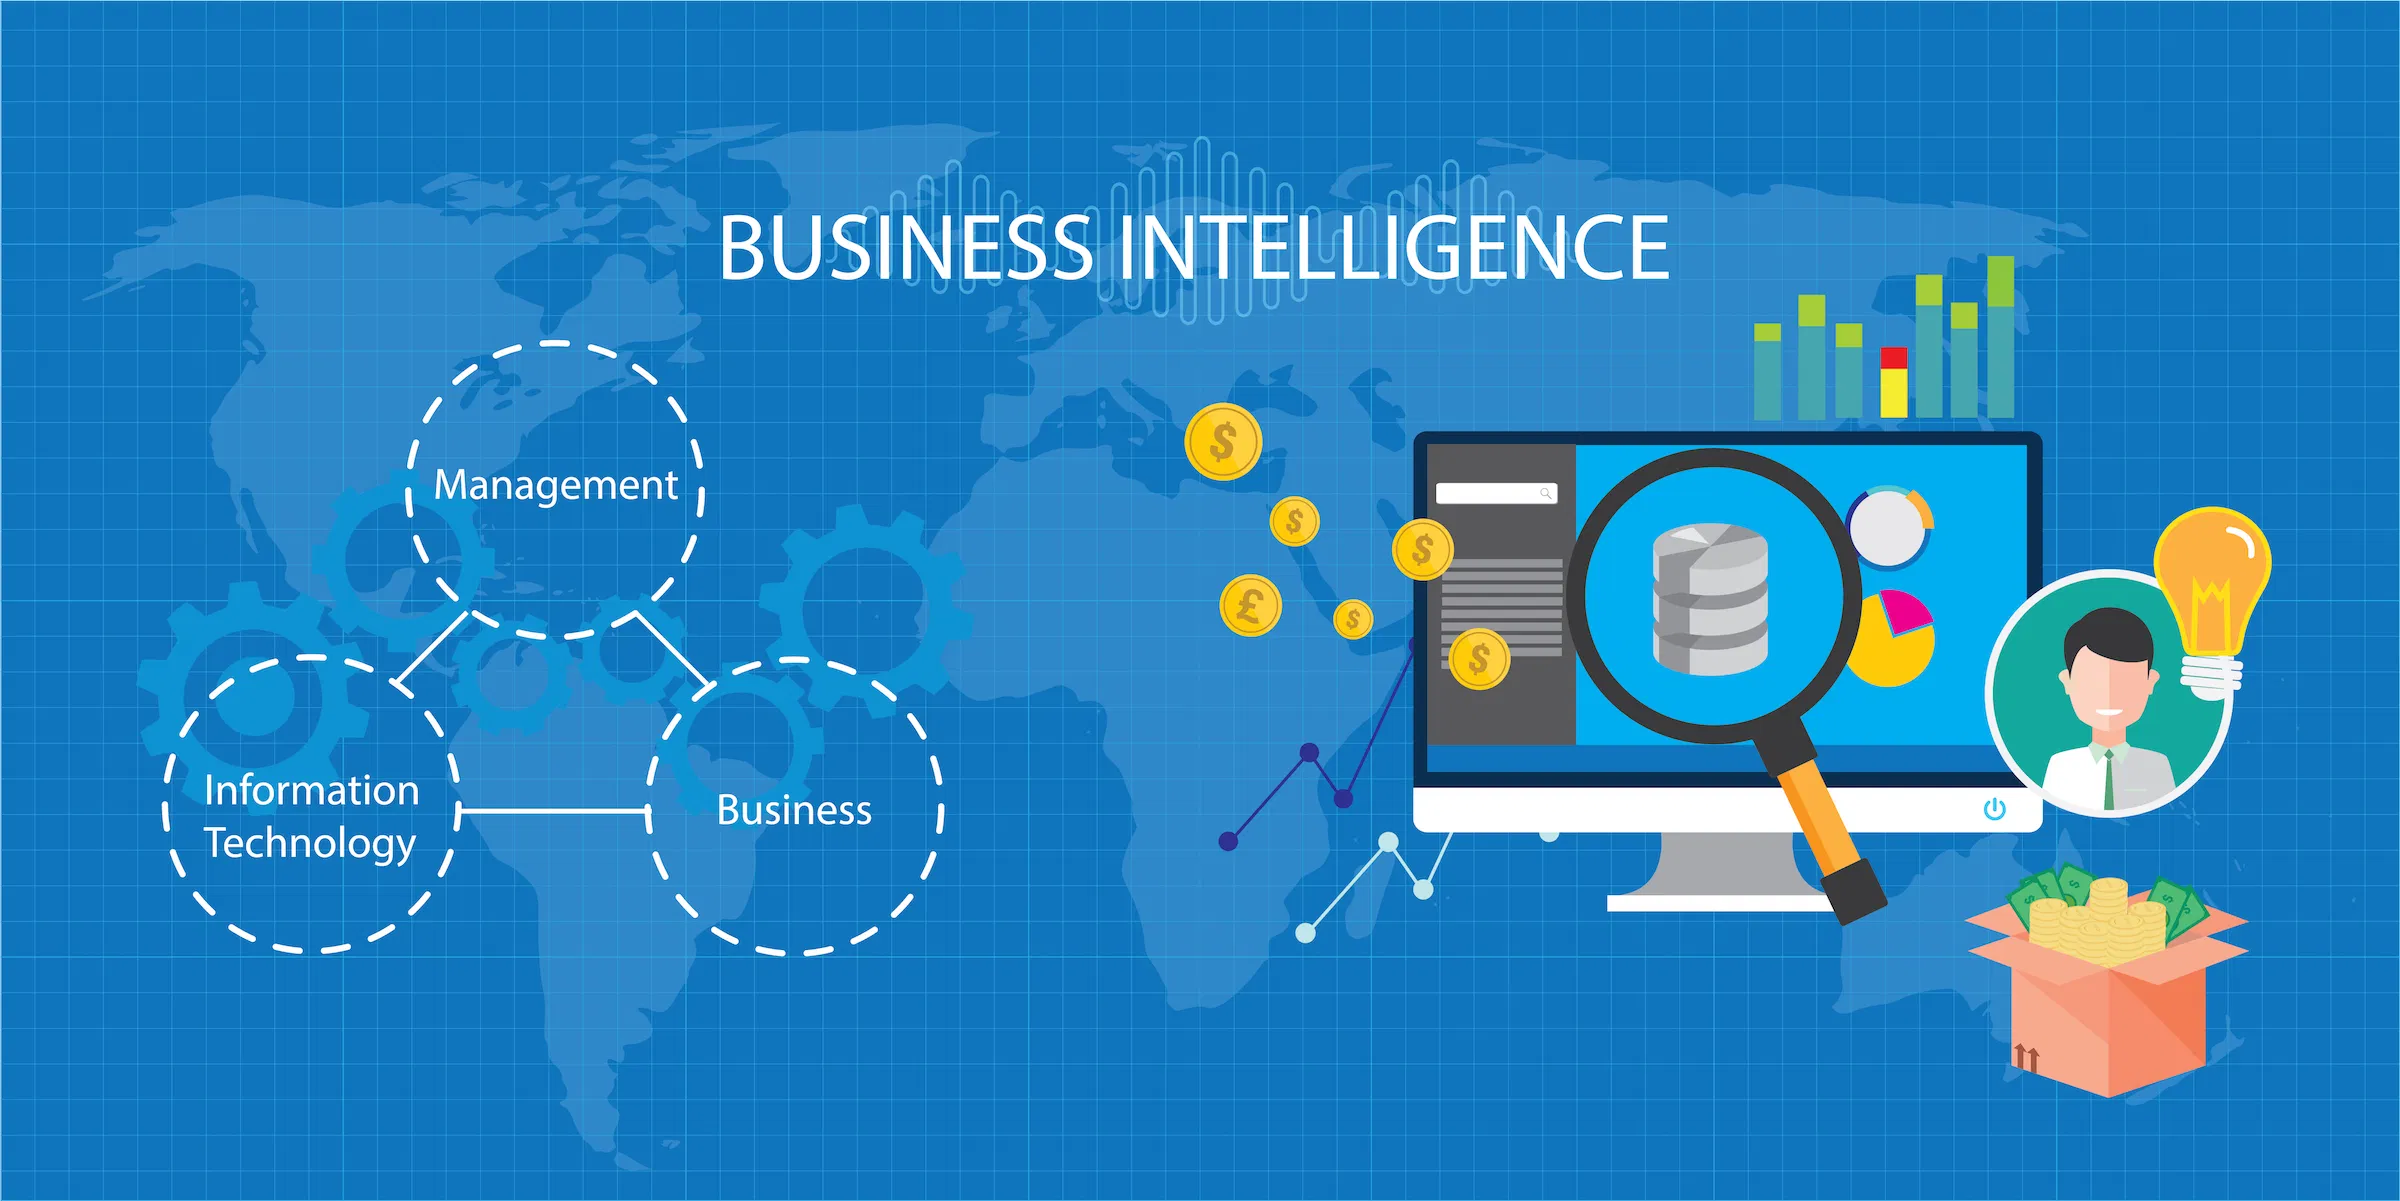
Business intelligence (BI) leverages software and services to transform data into actionable insights that inform an organization’s strategic and tactical business decisions. BI tools access and analyze data sets and present analytical findings in reports, summaries, dashboards, graphs, charts and maps to provide users with detailed intelligence about the state of the business.
BI tools are types of software used to gather, process, analyze, and visualize large volumes of past, current, and future data in order to generate actionable business insights, create interactive reports, and simplify the decision-making processes.
These tools include key features such as data visualization, visual analytics, interactive dashboarding and KPI scorecards. Additionally, they enable users to utilize automated reporting and predictive analytics features based on self-service.The most efficient BI software are Power BI, Tableau, Seeq, ChartMogul, AktivTrak, Clear Analytics, Databox, Pipeline, Domo, Kyubit, MicroStrategy, SAP BusinessObjects, SAS Business Intelligence, Yellowfin BI, IBM Cognos Analytics, Cluvio, GoodData
The benefits of business intelligence software
Professional software and tools offer various prominent benefits, here we will focus on the most invaluable ones:
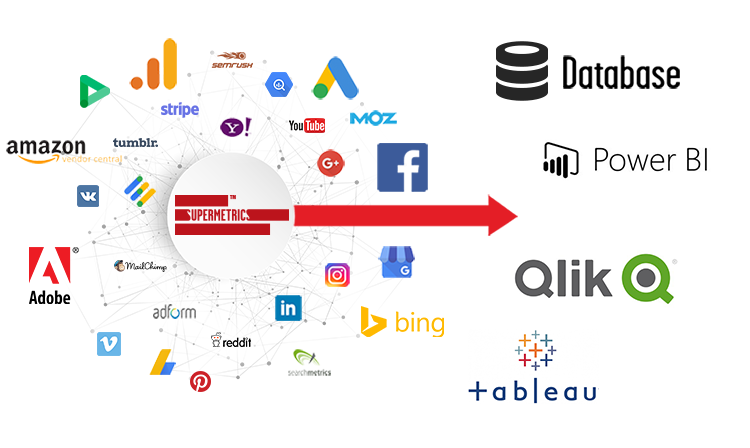
- They bring together all relevant data: Whether you work in a small company or large enterprise, you probably collect data from various portals, ERPs, CRMs, flat files, databases, APIs, and much more. You need to obtain a high level of data intelligence to be able to manage all these sources and develop a better understanding of the collected information. That’s why utilizing modern data connectors will help you in centralizing the disparate sources and provide you with a single point of view on all your business processes. That way, identifying issues, trends, and taking action are closely connected and based solely on data.
- Their true self-service analytics approaches unlock data access: When each person in the company is equipped with modern business intelligence software that will enable him/her to explore the data on their own, the need to request reports from the IT department is significantly reduced. This self-service BI approach gives organizations a competitive advantage because each employee will be equipped with the right amount of data analytics skills that will, ultimately, save the company’s time and resources while unburdening the IT department, hence, enabling them to focus on other critical tasks.
- Users can take advantage of predictions: Predictive analytics doesn’t need to be a specialty of data scientists or analysts. With the integration of forecast engines business users can generate insights for future scenarios that will help them in adjusting current strategies to deliver the best possible results. On the other hand, if a business condition changes, intelligent data alerts safeguard the anomalies that can occur while you manage huge amounts of data, and discover new trends and patterns that will enable you to react immediately.
- They eliminate manual tasks: While traditional means of business management encourage the use of spreadsheets and static presentations, modern software eliminates endless amounts of rows and columns and facilitates the automation of processes. The tool updates your KPI dashboard itself with real-time data. Besides, you can automate the reporting process with specified time intervals and purely look at the results. Simply drag-and-drop your values and see how you can easily create a powerful interactive dashboard that enables you to directly interact with your screen.
- They reduce business costs: From sales planning and customer behavior analysis to real-time process monitoring and offer optimization, BI platforms enable faster planning, analysis, and reporting processes. In fact, according to a survey conducted by the BI survey, more than 50% of business intelligence users reported that these are the most prominent benefits that helped them reducing costs, and increasing revenues. If you can work fast and accurate, you can achieve far better business results and make profitable adjustments.
- They’re constantly at your service, 24/7/365: Various organizations require various needs and the Software-as-a-Service model offered by these tools will provide a full SaaS BI experience, with all the data hosted in a secure online environment. According to your needs, the software can scale or de-scale, thus, adjusting to the specific needs of a company. Since the data is stored on a cloud, you have non-stop access to the software, where you can fully explore various self-service analytics features no matter if you’re a manager, data scientist, analyst or consultant.
These business intelligence benefits are focused both on small companies and large enterprises. If you need to control your data and know what’s going on in your company, BI is the way to do so. To help you on the way, we have created a business intelligence tools list that not only will ensure your data management and discovery become intuitive and easy to use, but also stay secured and guarantee a higher level of productivity, and, consequently, increased profits.,
Power BI
Power BI – business analytics software by Microsoft, which provides interactive visualizations and business intelligence capabilities with an interface simple enough for end users to create their own reports and dashboards.

Power BI made of 6 main components, these components released in the market separately, and they can be used even individually. Components of Power BI are:
- Power Query: Data mash up and transformation tool.
- Power Pivot: In-memory tabular data modelling tool
- Power View: Data visualization tool
- Power Map: 3D Geo-spatial data visualization tool
- Power Q&A: Natural language question and answering engine.
- Power BI Desktop: A powerful companion development tool for Power BI
There are many other parts for Power BI as well, such as;
- PowerBI.com Website; which Power BI data analysis can be shared through this website and hosted there as cloud service
- Power BI Mobile Apps; Power BI supported in Android, Apple, and Windows Phones.
Power BI components can be used individually or in a combination. Power Query has an add-in for Excel 2010 and Excel 2013, and it is embedded in Excel 2016. The add-in for Power Query is available for free! for everyone to download and use it alongside with existing an Excel (as long as it is Excel 2010 or higher versions). Power Pivot has been as an add-in for Excel 2010, from Excel 2013 Power Pivot is embedded in Excel, this add-in is again free to use! Power View is an add-in for Excel 2013, and it is free for use again. Power Map is an add-in for Excel 2013, it is embedded in Excel 2016 as 3D maps. Power Q&A doesn’t require any installation or add-in, it is just an engine for question and answering that works on top of models built in Power BI with other components.
Tableau
Tableau – an integrated business intelligence and analytics solution that helps to analyze key business data and generate meaningful insights. The solution helps businesses to collect data from multiple source points such as SQL databases, spreadsheets, cloud apps like Google Analytics and Salesforce to create a collective dataset.
Tableau’s live visual analytics and interactive dashboard allow slicing & dicing datasets for generating relevant insights and exploring new opportunities. Users can create interactive maps and analyze data across regions, territories, demographics and more. Tableau helps to create a narrative story of the data analysis with interactive visualizations that can be shared with their audience.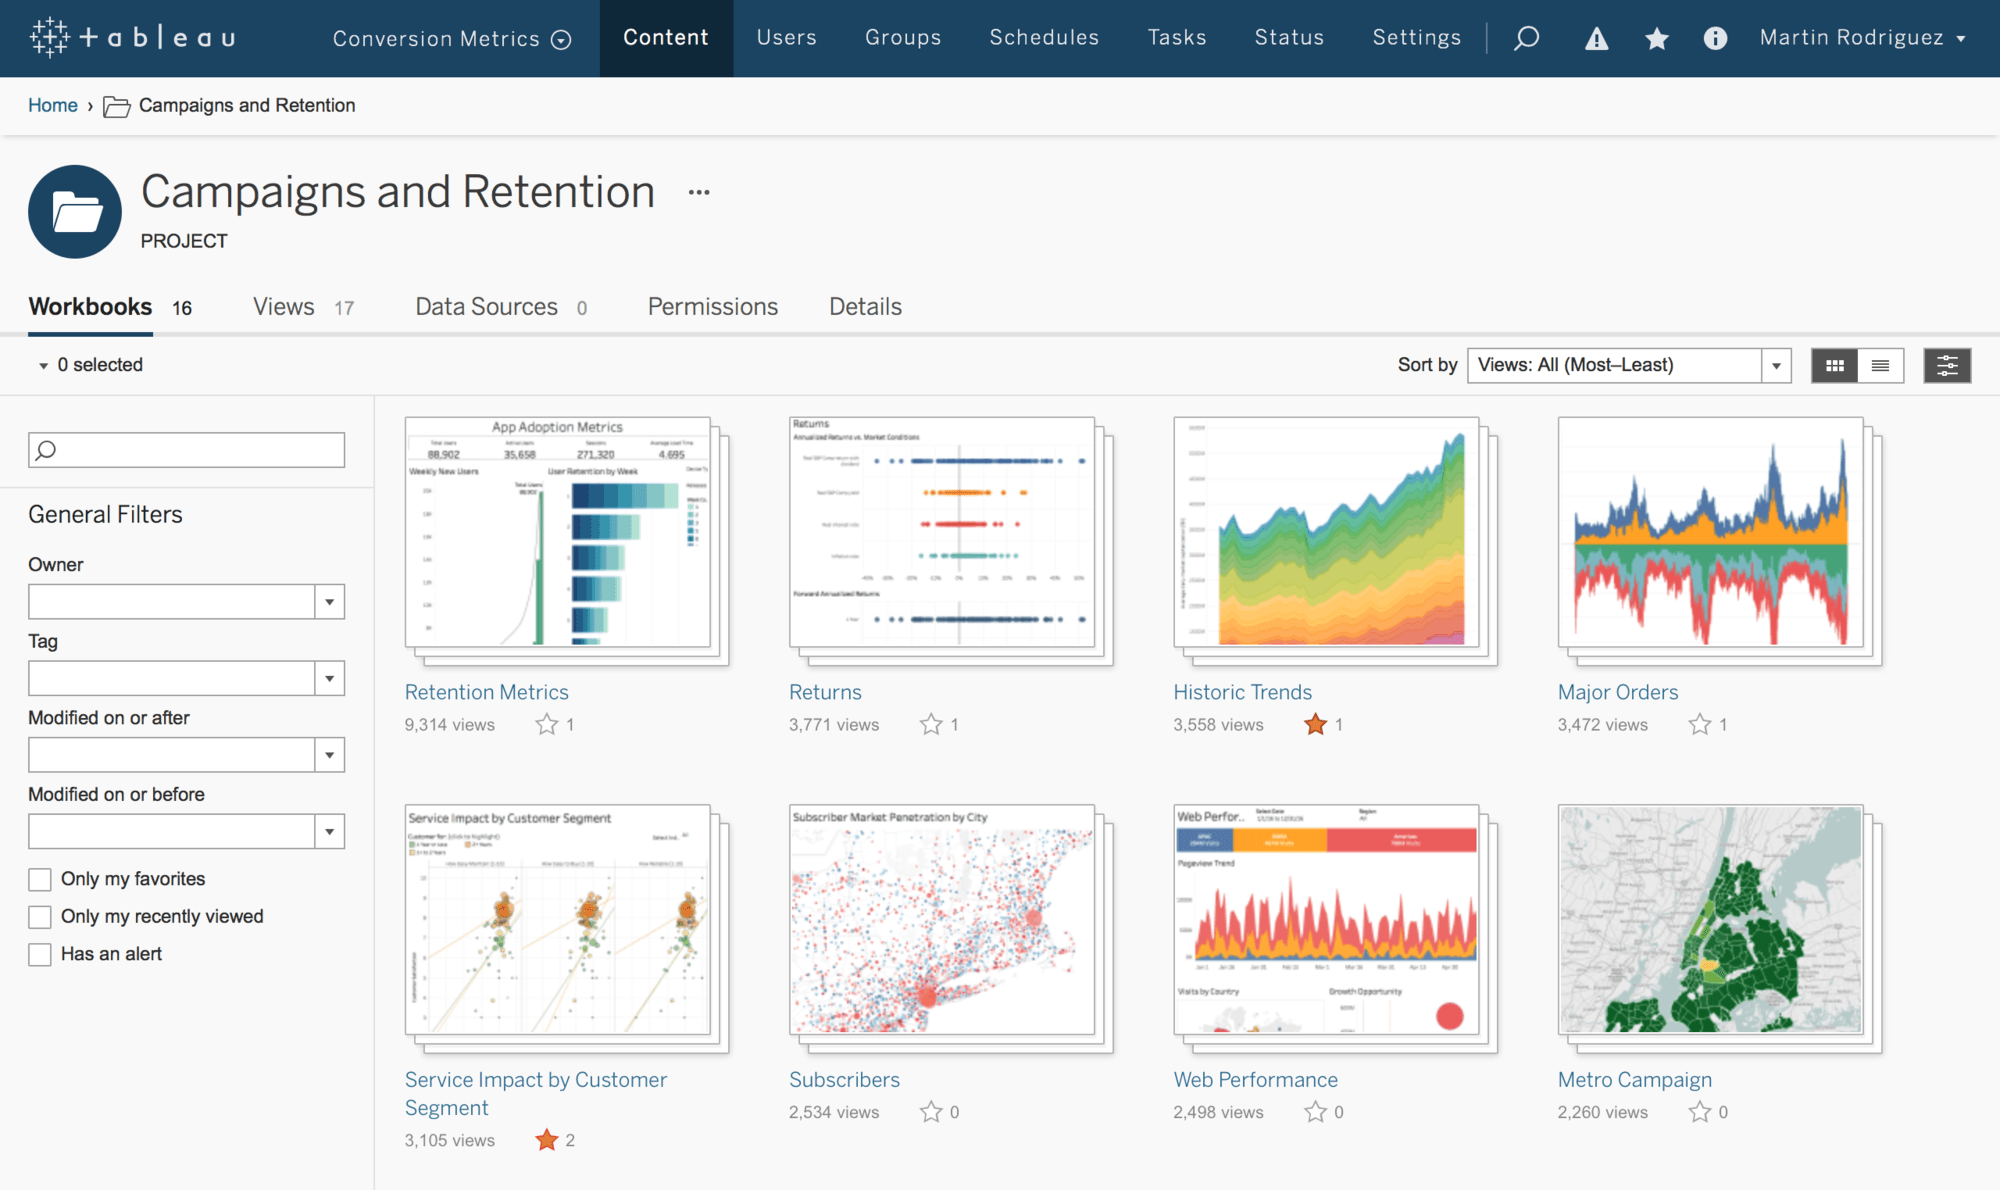
Tableau products include:
- Tableau Desktop (Both professional and personal editions)
- Tableau Server
- Tableau Online
- Tableau Prep Builder
- Tableau Vizable
- Tableau Public
- Tableau Reader
Tableau can be customized to serve a number of industry verticals including banking, communication, education, healthcare, real estate, manufacturing and technology. The solution can be either installed on-premises or hosted on the cloud as a SaaS application. Users can also view and analyze data on their Android and iOS smartphones with Tableau Mobile app.
Qlik Sense
Qlik Sense – a business and visual analytics platform that supports a range of analytic use cases. Built on Qlik’s unique Associative Engine, it supports a full range of users and use-cases across the life-cycle from data to insight
Qlik Sense sets the benchmark for third-generation analytics platforms, empowering everyone in organizations to make data-driven decisions. People of all skill levels get unmatched analytical power, with unique associative exploration and search, AI-powered insight suggestions, AI-accelerated creation and data prep, advanced analytics integration, and natural-language, conversational interaction. They can easily share and communicate the insights they discover and get answers anywhere they work – with fully interactive and secure online and offline mobility. And for the enterprise, you get a true platform with open and standard APIs for customization and extension, powerful data integration and connectivity, centralized management and governance, and a Kubernetes based SaaS / multi-cloud architecture driving scalability across combinations of on-premise, private, and public cloud environments.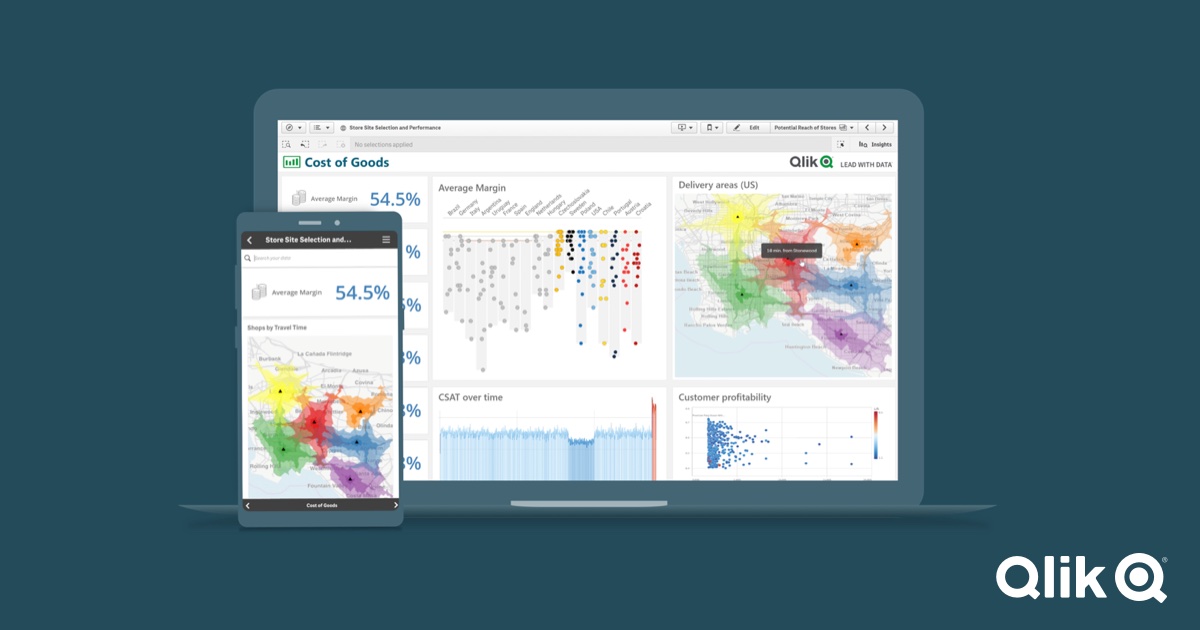
Features of Qlik Sense:
- Smart search options like Google and associative functions.
- Fast and reliable connections to multiple data sources.
- Drag and drop visualizations
- Generate personalized reports and detailed, interactive dashboards.
- Self-service data discovery
The Qlik Sense system offers data visualization and discovery for individuals and teams. The software’s data discovery tool helps businesses of all sizes explore simple and complex data and find all possible associations in their datasets. With the drag and drop interface, users can create interactive data visualizations to present the outcome in a story form.
Seeq
Seeq is an advanced analytical application fully integrated with the PI Data Archive and PI Asset Framework. Seeq delivers a hybrid approach to analytics, easily combining first principals, statistics, and machine learning. Seeq’s approach brings self-service analytics for engineers and scientists, collaboration and knowledge capture for teams, and publishing and real time views for managers and operators.
It enables users to get more value out of data, including OSIsoft PI System, Honeywell’s UniformancePHD, Emerson DeltaV and Ovation, Inductive Automation’s Ignition, AspenTech IP.21, Wonderware, GE Proficy or any other, by providing interactive, visual tools to accelerate industrial process analytics.
Seeq can be set up and running on a dedicated server, server cluster, or virtual machine in as little time as an hour. On-premise installations on the same network as a plant or enterprise historian, or on the cloud (Microsoft Azure, Amazon Web Services, etc.), or on a mixed environment of on-premise and cloud resources are supported.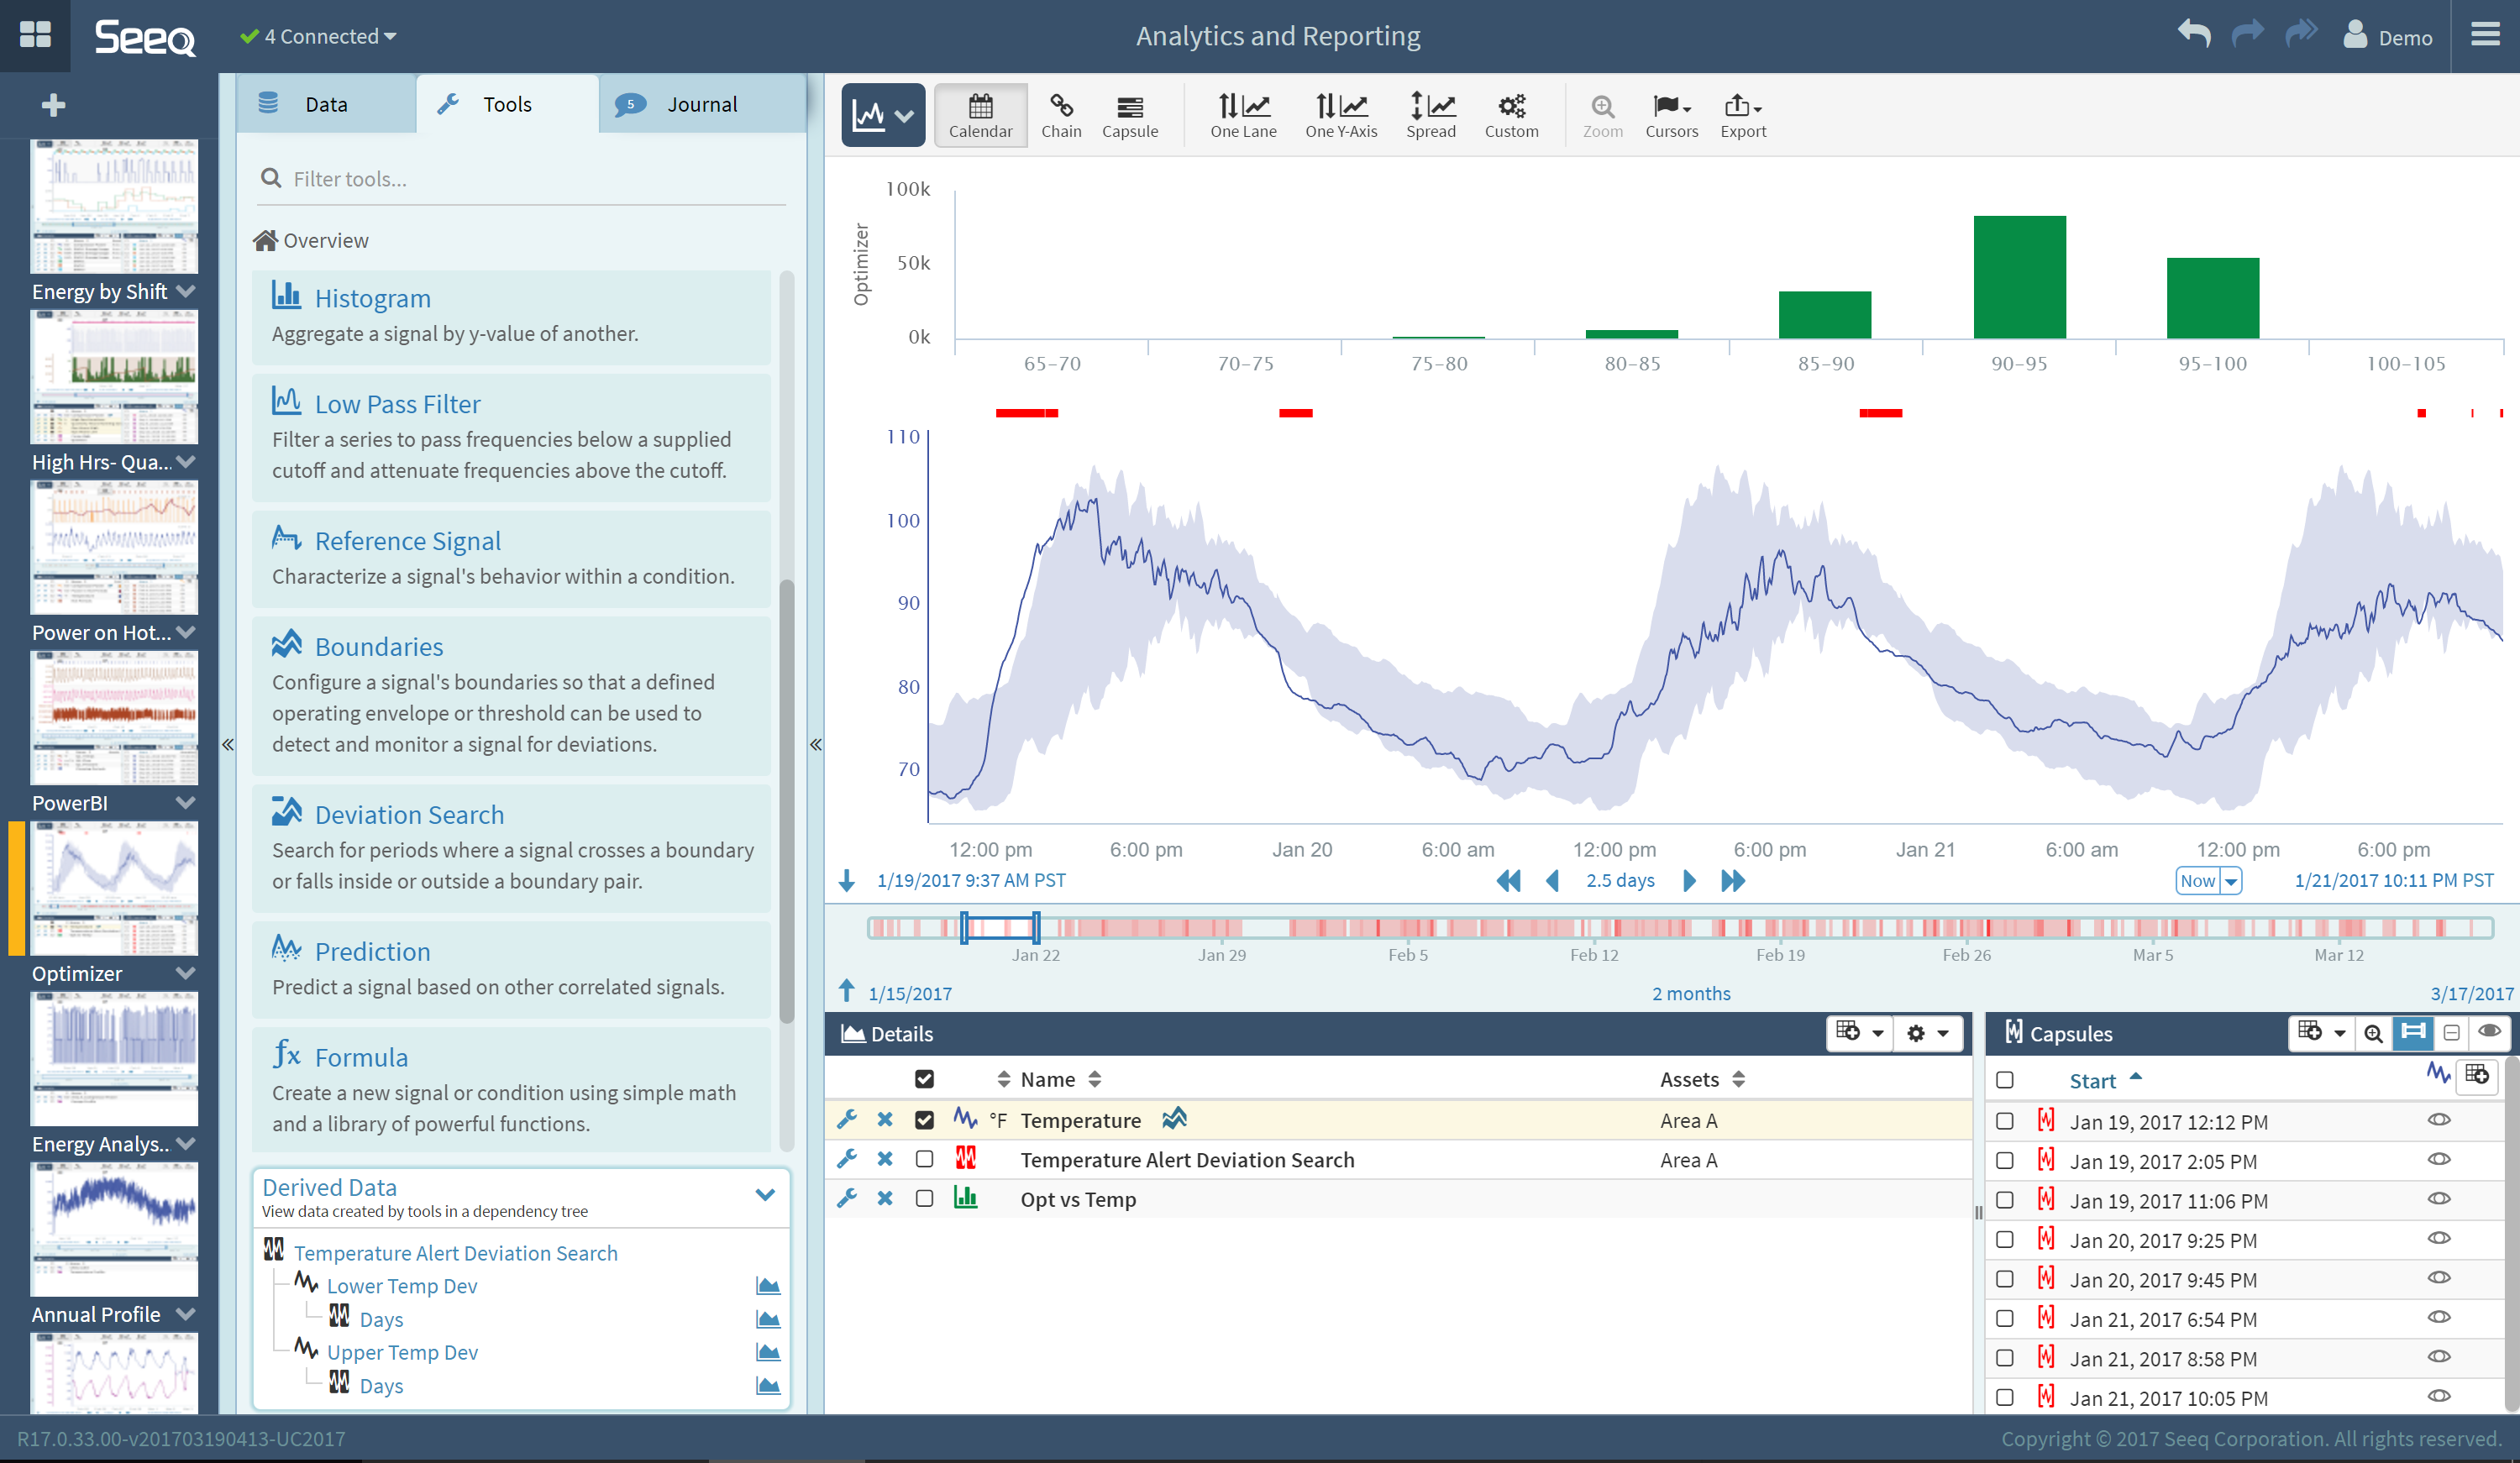 This software is extensible through data export, data integration, and a REST API for creating custom templates and modules. Data export options include Microsoft Excel and PowerPoint, and any OData client (Tableau, Microsoft PowerBI, etc.). Data integration with OSIsoft Vision is supported, and the REST API has SDKs for programming in C#, Python, MatLab, and Java.
Seeq does not copy or duplicate data from the source of record. Instead, data is accessed via a connector retrieving data on the fly based on user actions. All Seeq documents such as workbooks, worksheets, topics, and search definitions are stored by Seeq for easy user access and sharing.
datapine
datapine is a BI software that lets you connect your data from various sources and analyze with advanced analytics features (including predictive). With your analysis, you can create a powerful business dashboard (or several), generate standard or customized reports or incorporate intelligent alerts to get notified of anomalies and targets. This tool, rated with outstanding 4.6 stars on Capterra, is a powerful solution for businesses of all sizes since datapine can be implemented for various industries, functions, and platforms, no matter the size.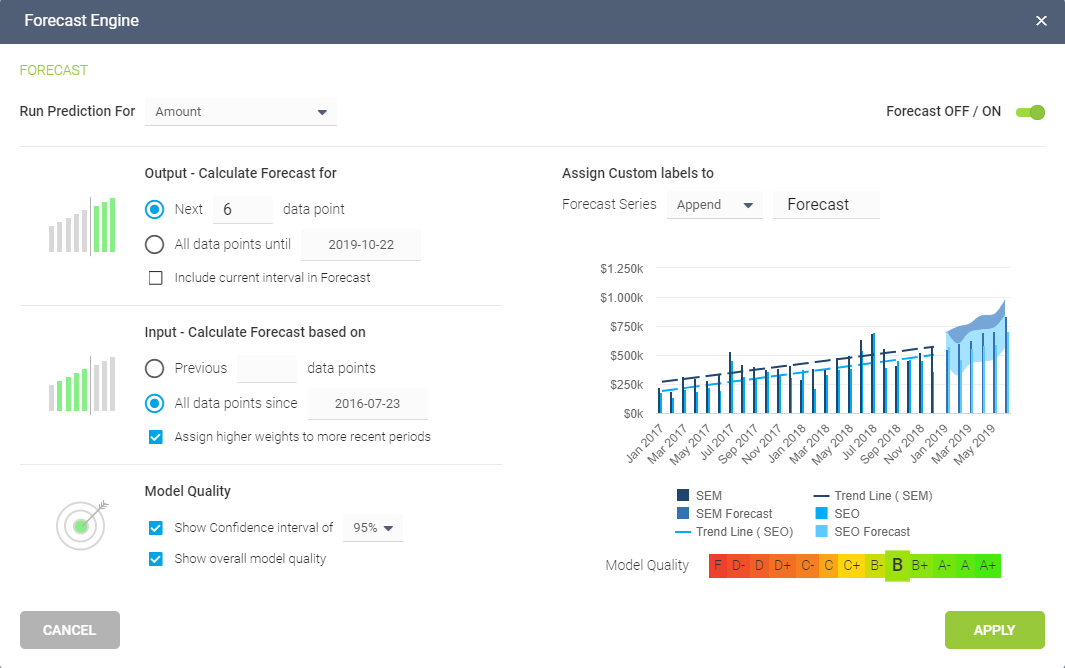
The tool offers features for both advanced users such as data analysts and average business users. The SQL mode enables analysts to create their own queries while, on the other hand, the intuitive drag-and-drop interface ensures a visually intuitive way of entering your values and creating powerful charts and dashboards, simply by using effective visual analytics.
datapine is a BI software that lets you connect your data from various sources and analyze with advanced analytics features (including predictive). With your analysis, you can create a powerful business dashboard (or several), generate… Click To TweetKey features:
- Intuitive drag-and-drop interface: Simply drag your KPIs into the interface and see how your charts and graphs transform into a professional dashboard without any IT involvement or advanced coding.
- Easy-to-use predictive analytics: Advanced analytics features, including predictive analysis based on a forecast engine, where you simply select the KPI, determine the number of data points you want to forecast, specify the previous data points for the calculation, and finally define the model quality by appointing the desired confidence interval.
- Many interactive dashboard features: Dig deep into each part of the dashboard with advanced dashboard software features such as drill-downs, chart zooms, widget linking, hierarchical filters, among others, that will ensure a detailed data discovery process.
- Multiple reporting options: Take advantage of BI reporting tools and create standard or customized reports by sharing via URL, enabling viewer access or sending an automated e-mail report which you can automate on specific time intervals. Additionally, you can embed datapine into your own application.
- Smart insights and alarms based on artificial intelligence: They alert the user if a business anomaly occurs or generate multiple types of insights, including growth, trends, value drivers, what-if scenarios, among others.
They do offer mobile access, but the dashboards are not directly accessible unless you download their app and customize them within the mobile view.
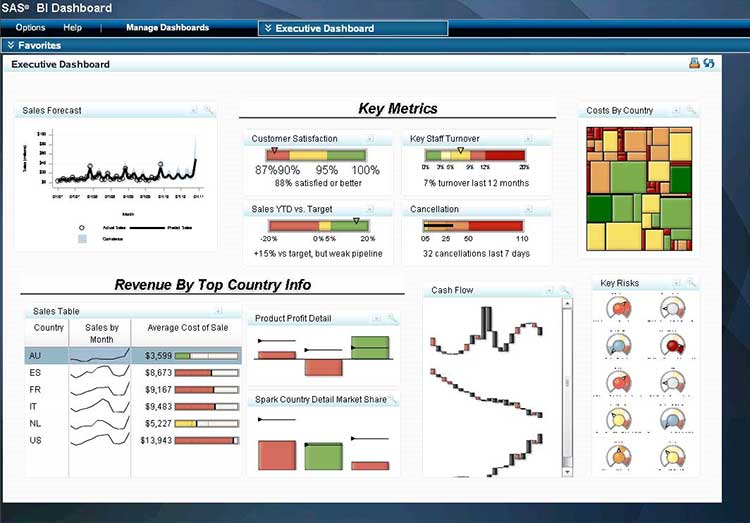
SAS Business Intelligence
SAS Business Intelligence is a software solution offering numerous products and technologies for data scientists, text analysists, data engineers, forecasting analysts, econometricians, and optimization modelers, among others. Founded in the 70s, SAS Business Intelligence enjoys a long tradition in the market, building and expanding its products every year.
Key features:
- 5 main subjects: SAS offers different BI products and technologies that are focused on visual data exploration and easy analytics, interactive reporting and dashboards, collaboration, and mobile apps.
- Data exploration supported by machine learning: SAS’ data exploration offers automated analysis supported by machine learning compiled in interactive visualizations
- Text analytics capabilities: Interesting features are text analytics that enables you to gain insights from text data such as social media and location analytics that combines data in a geographical context.
- Reports and dashboards across devices: Dynamic visuals are organized into interactive reports and dashboards, similar to other tools in our lists, and you can access them also on mobile and tablet devices (both Android and iOS).
- Integration with other applications: You can integrate SAS with Microsoft Office applications such as PowerPoint, Word, SharePoint or Excel with their Office Analytics solution which enables you to view your results directly in Microsoft Office Suite.
Clear Analytics
Clear Analytics is a tool that consolidates data from internal systems, cloud, accounting, CRM, and allows you to drag-and-drop that data into Excel. It works with Microsoft Power BI, using Power Query and Power Pivot to clean and model different datasets. Capterra gives a high user review of 4.5 stars making this tool also one of the highest-rated on our list.![]()
Key features:
- Reports delivered to Power BI: It delivers self-service ad hoc reporting directly to Power BI, hence enabling non-technical users to explore data stored in databases with their drag-and-drop interface and dynamic query designer.
- Connected with Excel: It bolts right into Excel, where you can specify end users’ viewing rights based on a user or role level, and manipulate formulas freely, whether you need to perform basic or advanced analysis.
- Sharing on mobile devices: You can use Power BI features such as Power Maps, Pivot and Desktop, where you can share your insights also to mobile devices, including iWatch.
- A full audit trail: They offer a full audit trail that enables you to know where the data came from, what filters were applied, who ran the report, and when the data was extracted.
- Fetch data elements with a semantic layer: A semantic layer will enable you to fetch data elements and organize them with modeling, visualizing, and transforming data to generate needed insights.
SAP BusinessObjects
SAP BusinessObjects is a business intelligence suite designed for comprehensive reporting, analysis, and data visualization. They provide Office integrations with Excel and PowerPoint where you can create live presentations and hybrid analytics that connects to their on-premise and cloud SAP systems. They’re focused on business categories such as CRM and customer experience, ERP and digital core, HR and people engagement, digital supply chain, and many more. To be accurate, more than 170M users leverage SAP across the world, making it one of the largest software suppliers in the world.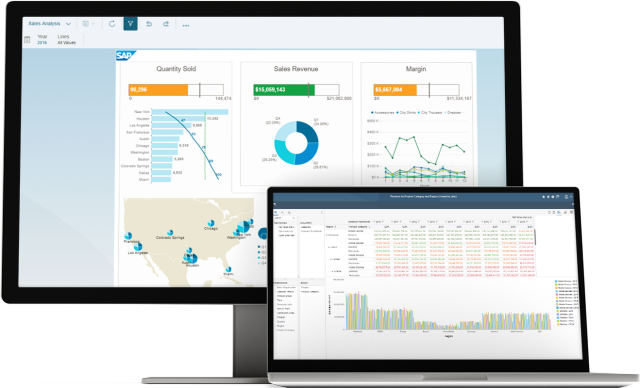
Key features:
- BI enterprise reporting system: Reporting and analysis are done with ad hoc queries and a complex BI enterprise reporting system designed to guide your overall company strategy.
- Self-service, role-based dashboards: Analytics applications and data visualization are focused on self-service capabilities, similar to other tools, where you can build your own role-based dashboards and applications to assess risks, for example.
- Cross-enterprise sharing: You can create a cross-enterprise sharing functionality that will enable you to communicate your findings with other stakeholders and partners.
- Connection with SAP Warehouse and HANA: Multidimensional data analysis enables you to filter and manipulate data with real-time analytics when you connect with SAP Business Information Warehouse (SAP BW) or SAP HANA.
- Integration with Office: By using Microsoft Excel with SAP, you can analyze larger volumes of data, and embed analytics in PowerPoint, making this solution easily integrated with Office.
- Some reviews report that extensive analysis functions are rarely usable without additional user training. In addition, the costs for the individual modules are relatively high and there are comparatively few feature updates.
Domo is a BI solution comprised of multiple systems that are featured in this platform, starting with connecting the data, and finishing with extending data with pre-built and custom apps from the Domo Appstore. You can use Domo also for your data lakes, warehouses, and ETL tools, alongside with R or Python scripts to prepare data for predictive modeling. Similar to other tools, you can connect the data across your enterprise, utilize their machine learning and artificial intelligence capabilities while enabling users to explore the data on their own. 
Key features:
Numerous pre-built cloud connectors: Data integration works similarly to other tools, as mentioned; you can connect to more than 1000 pre-built cloud connectors, on-premise with Domo Workbench, file upload such as Excel or Google Docs, proprietary systems, and federated connectors that will enable you to query the data where it’s hosted.
Magic ETL feature: Data transformation tools will enable you to prepare your data with a drag-and-drop Magic ETL, as Domo calls it, without the need to learn SQL.
Automatically suggested visualizations: Data visualization enables you to go from raw data to charts, graphs, maps, and other visualizations which are suggested automatically by Domo after you upload your data source. You can refine the data, annotate for further commentary or discussions, or refine and control who has access to it.
Mr. Roboto as an AI engine: Predictive analysis is powered with Mr. Roboto, Domo’s AI engine, that enables data scientists to create predictive models and utilize artificial intelligence, machine learning, natural language processing, and other AI technologies that alert and notify about changes in KPIs, for example.
Domo Appstore: Their open cloud platform is an ecosystem of pre-built apps, connector APIs and dashboards, giving you also the possibility to build your own and share it on the Domo Appstore.
Domo is not built for newcomers as the learning curve can be steep, but they do offer trainings, therefore, be prepared to learn. Their pricing models are not transparent, but you can assume it’s the most expensive solution on our list, according to the available information on the web.
Yellowfin BI
Yellowfin BI – a suite of products consisted of dashboards, signals, stories, data discovery and data prep, this BI analytics tool offers numerous features, including a mobile app available both for Android and iOS devices.
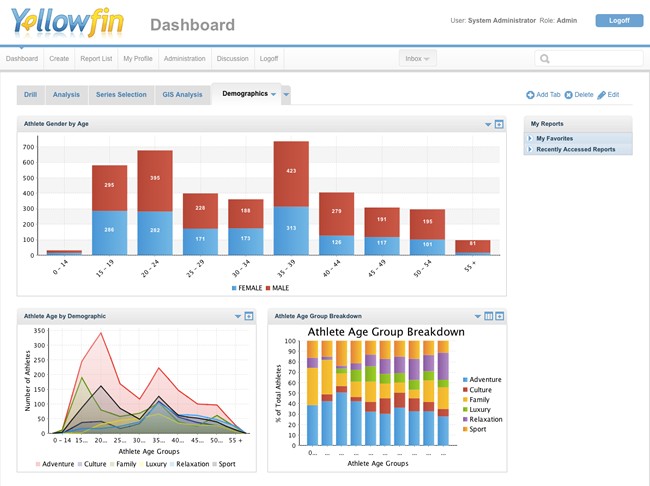
Key features:
- 5 main products: The Yellowfin BI suite combines 5 main products to connect, transform and understand your company data: Yellowfin signals, stories, dashboards, data discovery, and data prep.
- 3 areas of BI and analytics: They are specialized in 3 main areas of BI and analytics solutions: enterprise analytics, embedded analytics, and external analytical apps.
- Yellowfin signals via smartphone: Benefit from the automated detection of trends and anomalies in your data thanks to the Yellowfin signals, which are based on powerful, AI-controlled algorithms and enable immediate, personalized notifications directly to your smartphone.
- Persuasive data stories: Yellowfin stories enable users to combine data with a written narrative, video, and images to build trusted data reports, that put people first.
- Smart tasks: They offer trigger-based smart tasks that are automatically sent to the relevant person if a KPI falls below a standard. This enables everyone within the company to take the right action at the right time.
Some users wrote in their reviews that some essential analysis functions are not available that can be found in other BI tools. They also reported performance problems when dealing with larger data sets.
IBM Cognos Analytics
IBM Cognos Analytics is a cloud-based business intelligence software that utilizes AI recommendations when creating dashboards and reports, geospatial capabilities to overlay your data with the physical world, and enables you to ask questions in plain English to communicate with the software.
Key features:
Search mechanism: A new Cognos Analytics search mechanism that enables users to access, discover and access recently used content within the software, where you can filter and save your searches.
A single data module: Multiple data sources are joined into a single data module that doesn’t replace the IT department but allows users to generate and work with insights on their own.
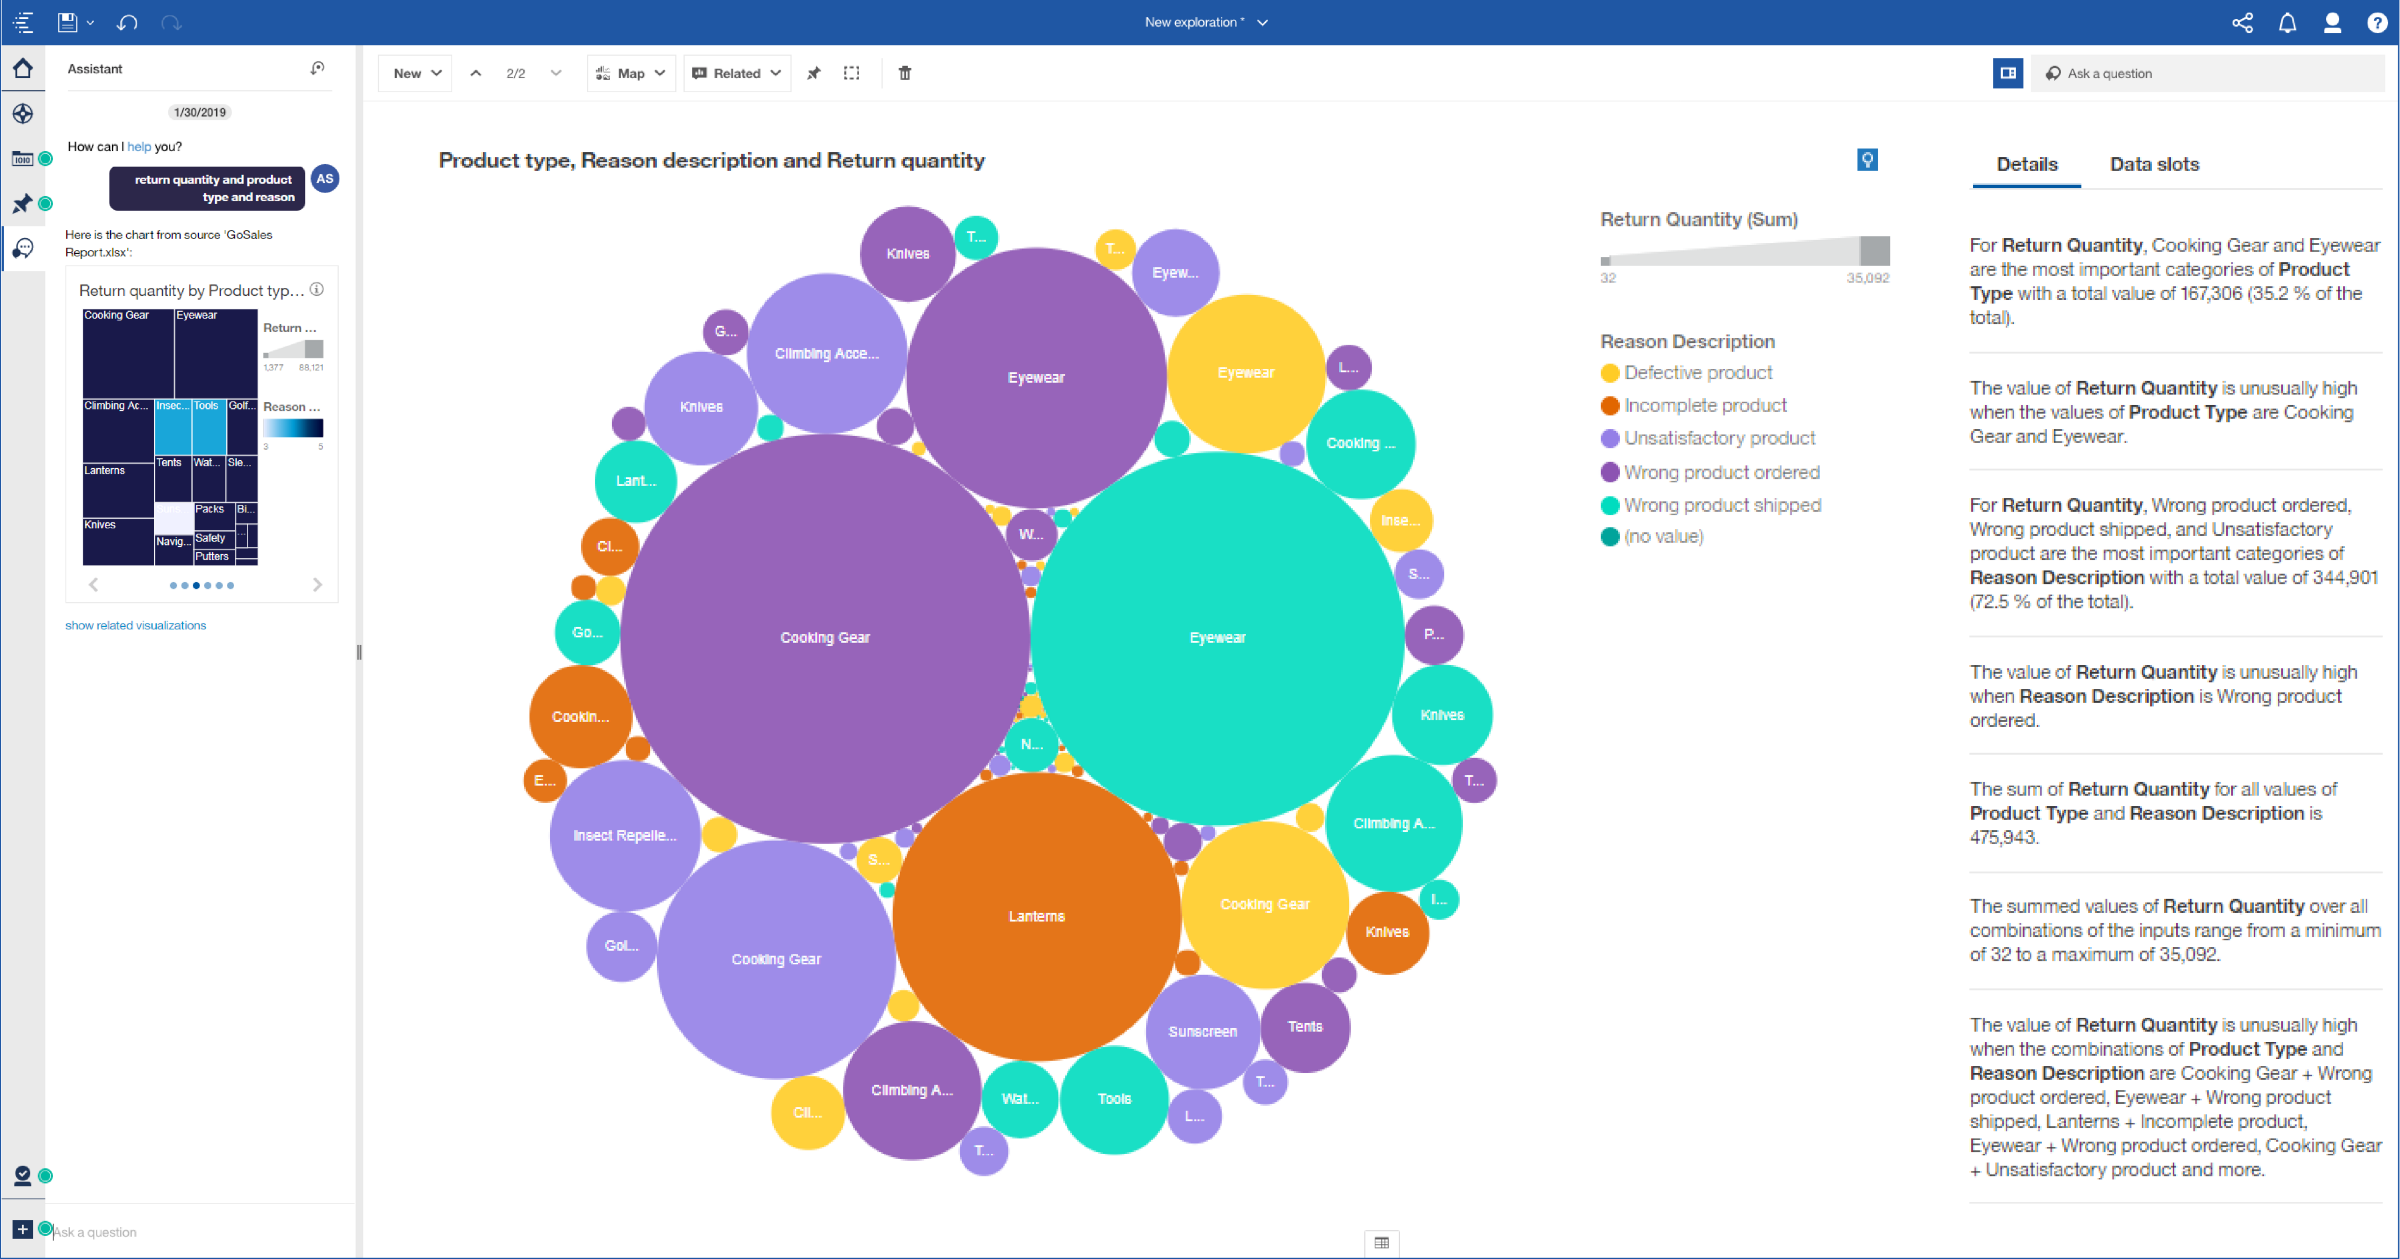
Interactive data visualization: Interactive visualizations are coupled with embedded geospatial mapping and advanced analytics.
AI assistant: Enables users to communicate in plain language: simply ask a question, and the assistant will recommend the most suitable visualizations.
Extensive knowledge center: Integration with other applications: A comprehensive knowledge center, community, and support for learning and understanding their product.
It will take a while to get familiar with all the features and capabilities this solution has on offer, and if you look for comprehensive dashboard features, this tool would not be suitable, as many users reported.
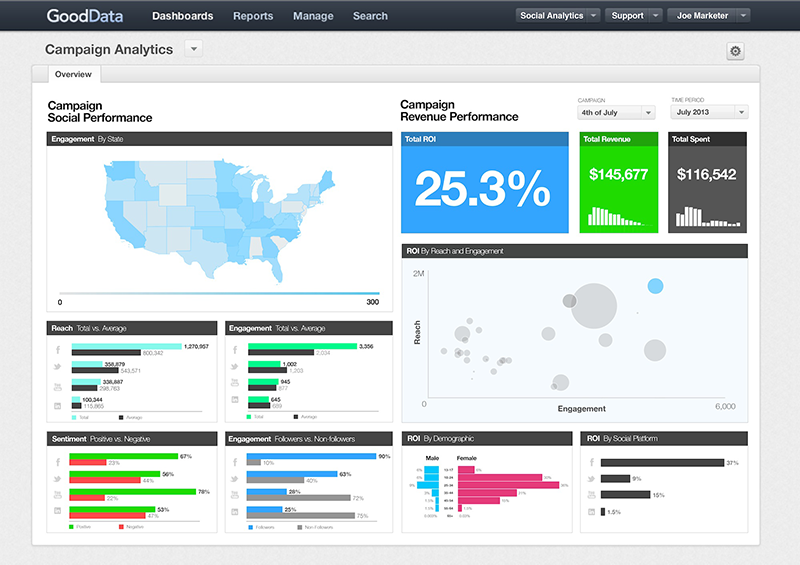
GoodData
GoodData is a business analytics software that provides the tools for data ingestion, storage, analytic queries, visualizations, and application integration. You can embed their analytics into your website, desktop or mobile application or create dashboards and reports for your daily activities, without the need to obtain a Ph.D., as stated on their website. Also one of the younger software solutions on our list, founded in 2007, GoodData received a stable 4 stars review on Capterra as one of the great tools to “manage your business.”
Key features:
- Customers can publish their own reports: Embedded analytics can be delivered at scale, for each customer you might have, with a wide range of customizations (custom data models and analytics) that let customers publish their own reports and dashboards.
- A modular data pipeline: They offer also modular data pipeline for fast data integration with an on-premise or cloud warehouse, no matter if the data is structured, semi-structured or unstructured. You can also use tools such as SQL, Python, R or Ruby for flexible data processing.
- A platform for developers: An open platform for developers provides you with frameworks to integrate with the existing data by utilizing white-labeled iFrames or their JavaScript library supported by numerous React components.
- Additional support: They offer additional services and support for the complete data and analytics lifecycle, including development, testing, launch, and maintenance.
- 4 Data centers: GoodData has 4 different data centers: two in the USA (Chicago and Dallas) and one in the EU and Canada, although the exact locations in these two regions are not specified. Existing projects can be transferred from one data center to another at any time.
Some users report it’s difficult to use despite completed training sessions and a higher price range for small businesses.
MicroStrategy
MicroStrategy is an enterprise analytics and mobility platform focused on hyperintelligence, federated analytics, and cloud solutions. Their mobile dossiers enable users to build interactive books of analytics that render on iOS or Android devices, with the possibility to extend the MicroStrategy content into their apps by using Xcode or JavaScript. You can download a sample app, MicroStrategy Mobile, or the Library app where you will enable you to deploy analytics on-the-go.
Key features:
- Hyperintelligence pulls your data: Their hyperintelligence feature pulls the data from various sources and puts them into relevant, zero-click insights, whether it’s a card on a website or integrated with a voice-over assistant. An interesting fact is that they provide contextual insights, you simply need to hover with your mouse, and the software will recognize the relevant data, directly in the website, applications, and devices you use.
- Federated analytics: It provides a common data glossary, no matter the tools you use, built on an enterprise semantic graph that indexes all the disparate data systems and enables visualizations of the same data.
- Mobile deployment: As mentioned, they also offer mobile deployment that enables users to leverage existing reports, dashboards and visualizations in real-time, from any location and device, with the possibility for code-free app development and design.
- Integration with voice technology: Powered by natural language processing and machine learning, you can also integrate voice technology and chatbots such as Alexa or Google Home.
- Cloud technology: Microstrategy offers a range of solutions to deliver scalable, secure, flexible and extensible cloud solutions that meet the needs of both business departments and IT.
- Some users report a complex initial setup since it involves many parties and in-depth knowledge of the application itself. Ease of use is certainly an aspect that the software lacks – you will need very knowledgeable staff to “get it up and running.”
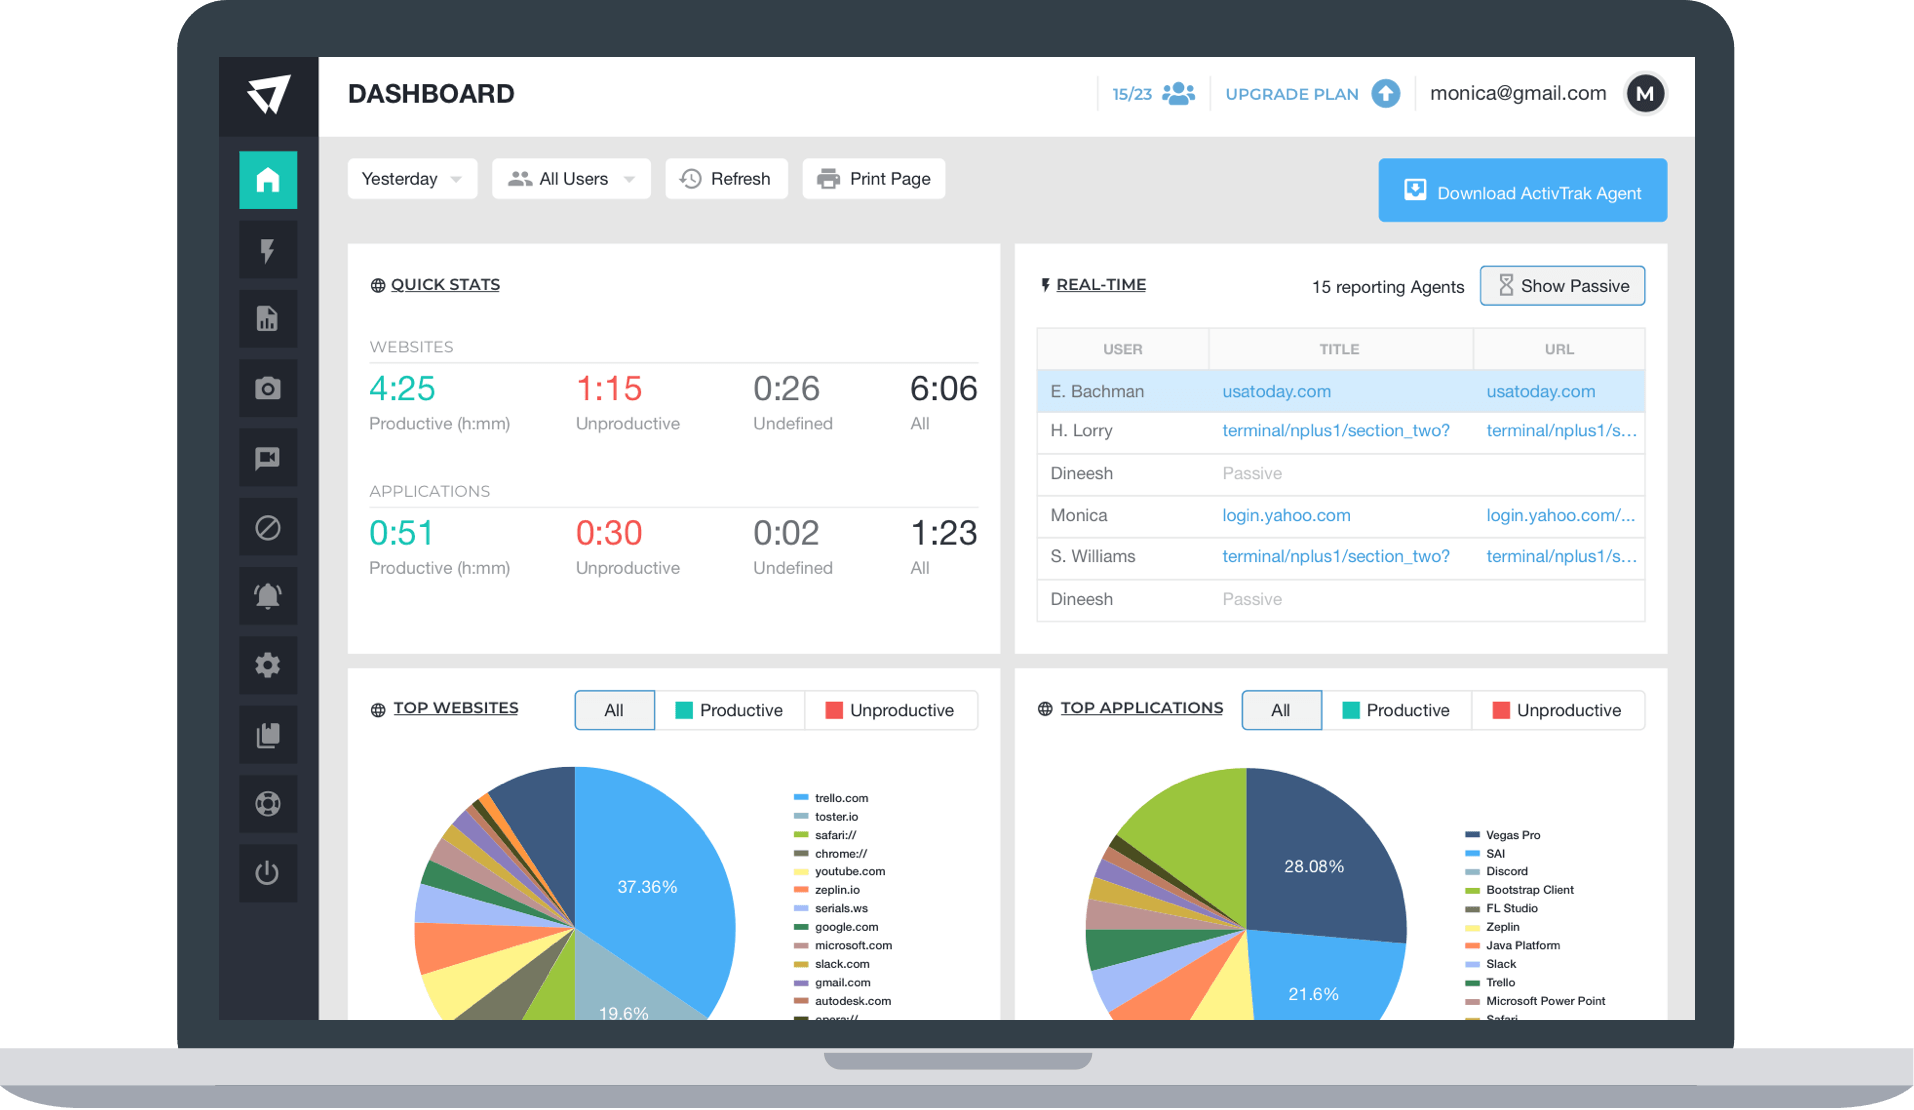
ActivTrak
ActivTrak from Birch Grove Software is a flexible BI tool for team behavior analytics. The full system can handle teams from five to 1,000 and is designed for business owners, IT and HR managers, and team leaders who want to track their team’s productivity.
This option can be deployed via the cloud, SaaS, and the web, and offers mobile applications for both iOS and Android. Support for ActivTrak is available online and via phone during business hours.
Features:
- With ActivTrak, companies can monitor their employees without them being aware of it. The application is invisible in the monitored computer’s system, therefore staff can remain unaware that their computer usage is being watched. This way, employers gain an unadulterated insight on their staffs’ behaviors.
- ActivTrak provides employers and administrators with a complete log of activities done on a unit. The application does this by keeping track of active applications and takes note when there are changes. Relevant information is included, such as which programs were deployed, how much time was spent on each application, and more.
- To provide further information, ActivTrak takes continuous screenshots of computer screens. This action is automated so the business owner, the IT department, or the administrators need not manually trigger the screen capture feature. This lets companies connect activities logged in the audit trail and with the screenshots taken at the time it was noted by the system.
- ActivTrak agents can view users’ computer activities real-time. They can watch a live stream of active windows on all monitored machines. On top of that, the software also provides relevant information from the window being used by an employee on a device under surveillance.
- With ActivTrak, companies can disable the use of websites they deem to be disruptive during work hours. They are also able to utilize this feature to ensure that staff do not visit websites that may be harmful to the company’s IT resources. This way, the business is protected from possible malicious infiltrations.
- ActivTrak comes with seven types of reports that let employers gain a comprehensive overview of their company productivity. With this feature, they can see which websites are the most visited, the applications most often used, and how employees go about their work tasks.
- ActivTrak confers upon the employers and their agents the ability to access raw data anytime. They are able to do this because of the application’s capability to integrate with data warehouse infrastructures.Furthermore, they can utilize this feature to connect to BI tools to synchronize with other business intelligence software.
ChartMogul
ChartMogul boasts well-known clients such as Typeform and Docker, which speaks to its ability to handle larger user bases. This software is best for businesses who are trying to build or grow a subscription service, as it can measure churn rate and customer lifetime value.
ChartMogul can be deployed via the cloud, SaaS, and the web. Support is available 24/7 through a live representative and online tutorials. Representatives also offer live online training to help businesses get started.
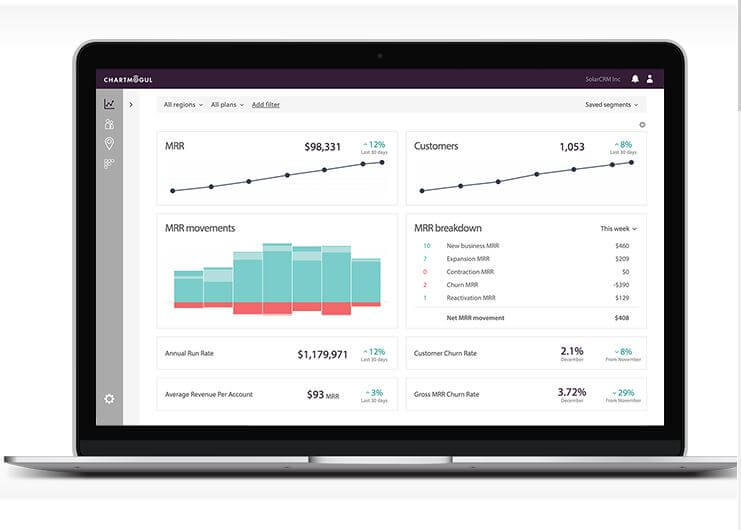
For one, users can easily review and analyze meaningful metrics. This provides you with deeper insights that enable them to truly understand the performance of your business. ChartMogul makes specifying metrics needed to analyze your subscription revenue a tad easier. With a more particular set of metrics, you can easily have a more intelligent breakdown of your company’s performance and determine areas that require attention and improvement.
ChartMogul also helps in quickly identifying the factors that cause customers to upgrade, downgrade and churn and focus on addressing issues that impede business growth. Another benefit ChartMogul provides is the ability to sync subscription data in real-time so that metrics and billing systems are always updated.
Cluvio
Cluvio is for businesses that have a staff member with a bit of data analytics experience. This software allows businesses to run SQL queries against their databases, can process data in R, and turns out some impressive-looking dashboards and data visualizations.
Cluvio can be deployed via the cloud, SaaS, and the web, and support is offered online or phone during business hours. If businesses need help getting started, the vendor offers webinars and live online training, as well as training materials.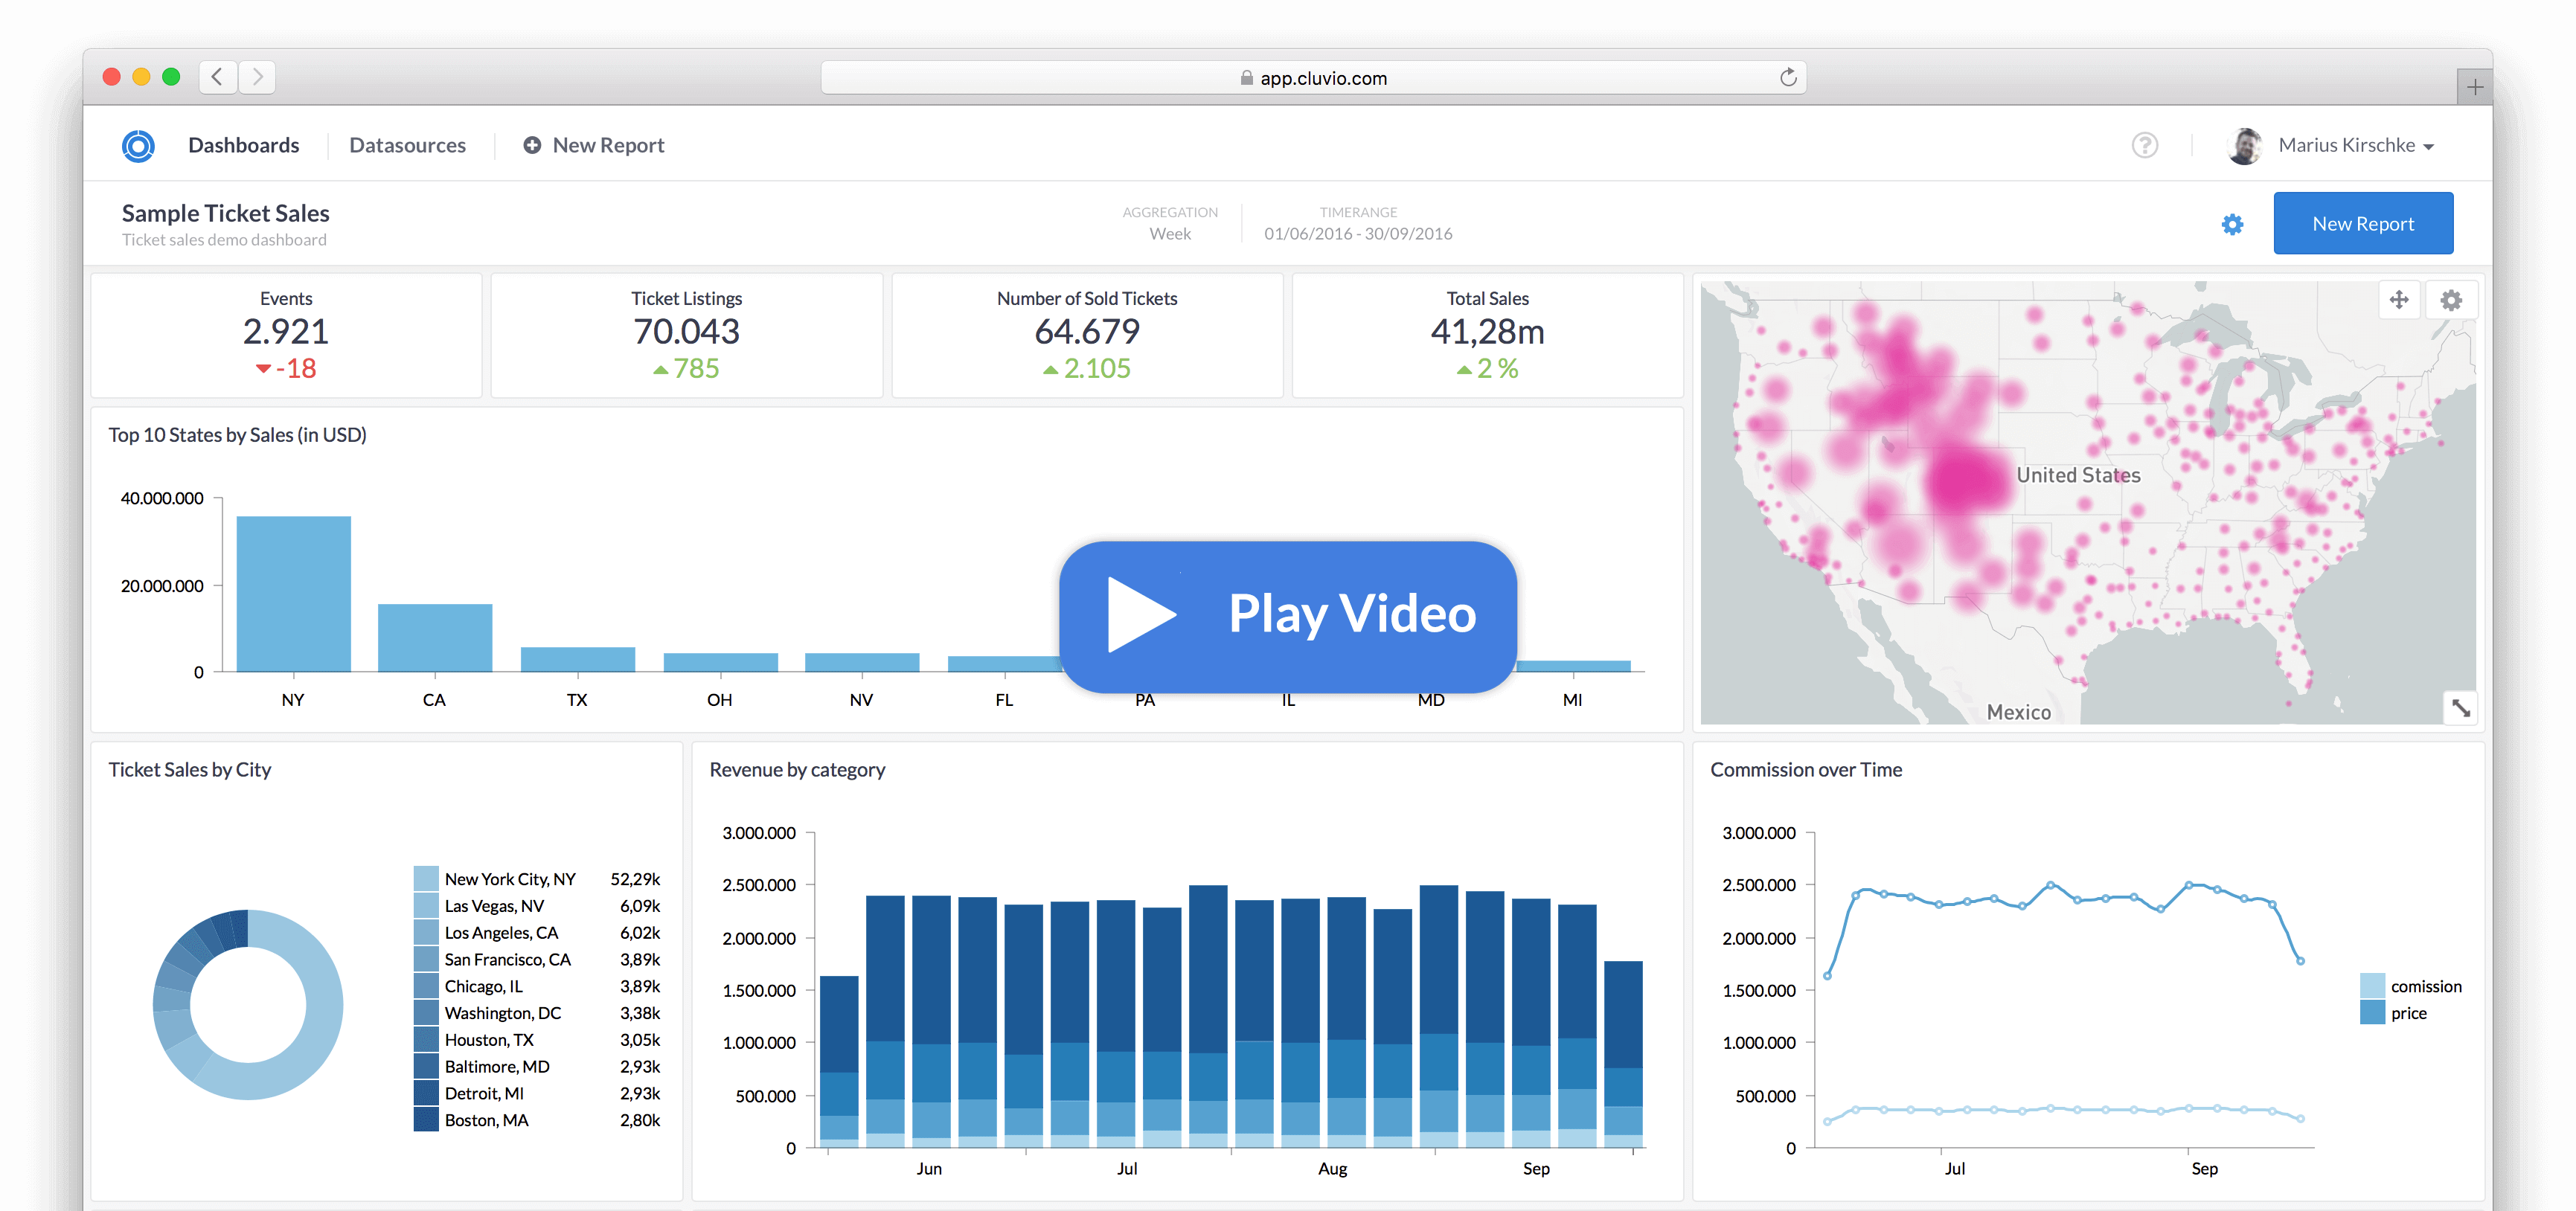
Key features include a SQL editor, customizable R scripts, push notifications, dashboard sharing with clients and more. The Cluvio dashboard can also be shared with the colleagues through a link which enables users to access it without logging in. Users to slice and dice data, specify date ranges and configure aggregation settings.
Cluvio offers integration with databases including PostgreSQL, MySQL, Amazon Redshift, Google BigQuery, MariaDB, Microsoft SQLServer, Amazon Web Services, Oracle, Google Cloud Platform, Amazon Aura, and Exasol.
Databox
Databox is the powerhouse of free BI software, scoring high with reviewers in ease-of-use, functionality, and customer support.
Databox allows businesses to track and report on their KPIs through a visually pleasing dashboard, can deliver information across multiple devices, and integrates with popular systems such as Adobe Analytics and Salesforce.Databox can be deployed via the cloud, SaaS, and the web, and offers mobile applications for iOS and Android. It is suitable for small to large businesses and offers mobile apps for iOS and Android devices.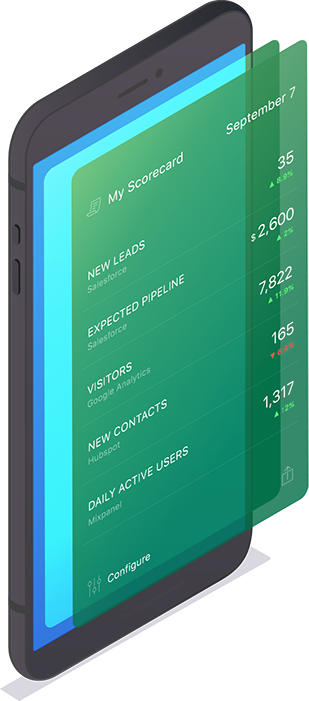 Users can connect with various sources of cloud-based data such as HubSpot, Google Analytics, Instagram, Stripe, Facebook Ads and Moz. Users can also import data from their own databases using Databox’s REST API and SDKs. The Databox mobile app provides real-time access to company performance in the form of daily scorecards, weekly summaries and alerts.
Kyubit Business Intelligence
Kyubit Business Intelligence by Kyubit Solutions is a flexible BI tool that allows businesses to create dashboards and reports from their OLAP, SQL, and CSV data. Although this tool is easy to use, the setup makes it best-suited for those who already have some data analytics knowledge or business intelligence training.
Kyubit can be deployed via the cloud, SaaS, the web, or as an installed software solution. Support is available online or during business hours. For the non-tech-savvy user, Kyubit offers training documents to guide you through the software.
Kyubit is a cloud-based and on-premise business intelligence platform designed for Microsoft SQL Server Analysis Services (SSAS) environments. Primary features include online analytical processing (OLAP) grid and chart analysis and dashboard visualization.
Kyubit can be deployed via the cloud, SaaS, the web, or as an installed software solution. Support is available online or during business hours. For the non-tech-savvy user, Kyubit offers training documents to guide you through the… Click To TweetKyubit features a drag-and-drop interface for creating OLAP visualizations. The system offers grid, chart and report-style views of the results of OLAP analysis. Users can also export results in Excel and PDF formats and share them with other users in the corporate intranet.
Dashboards enable users to provide overviews of key performance indicators (KPIs) and scorecards using SQL and OLAP database. Dashboard elements include OLAP analysis capabilities such as slice, drill down and drill through. Additionally, dashboard elements can be based on multidimensional expressions (MDX) and T-SQL queries.
Leave a Reply